One console, not five tabs
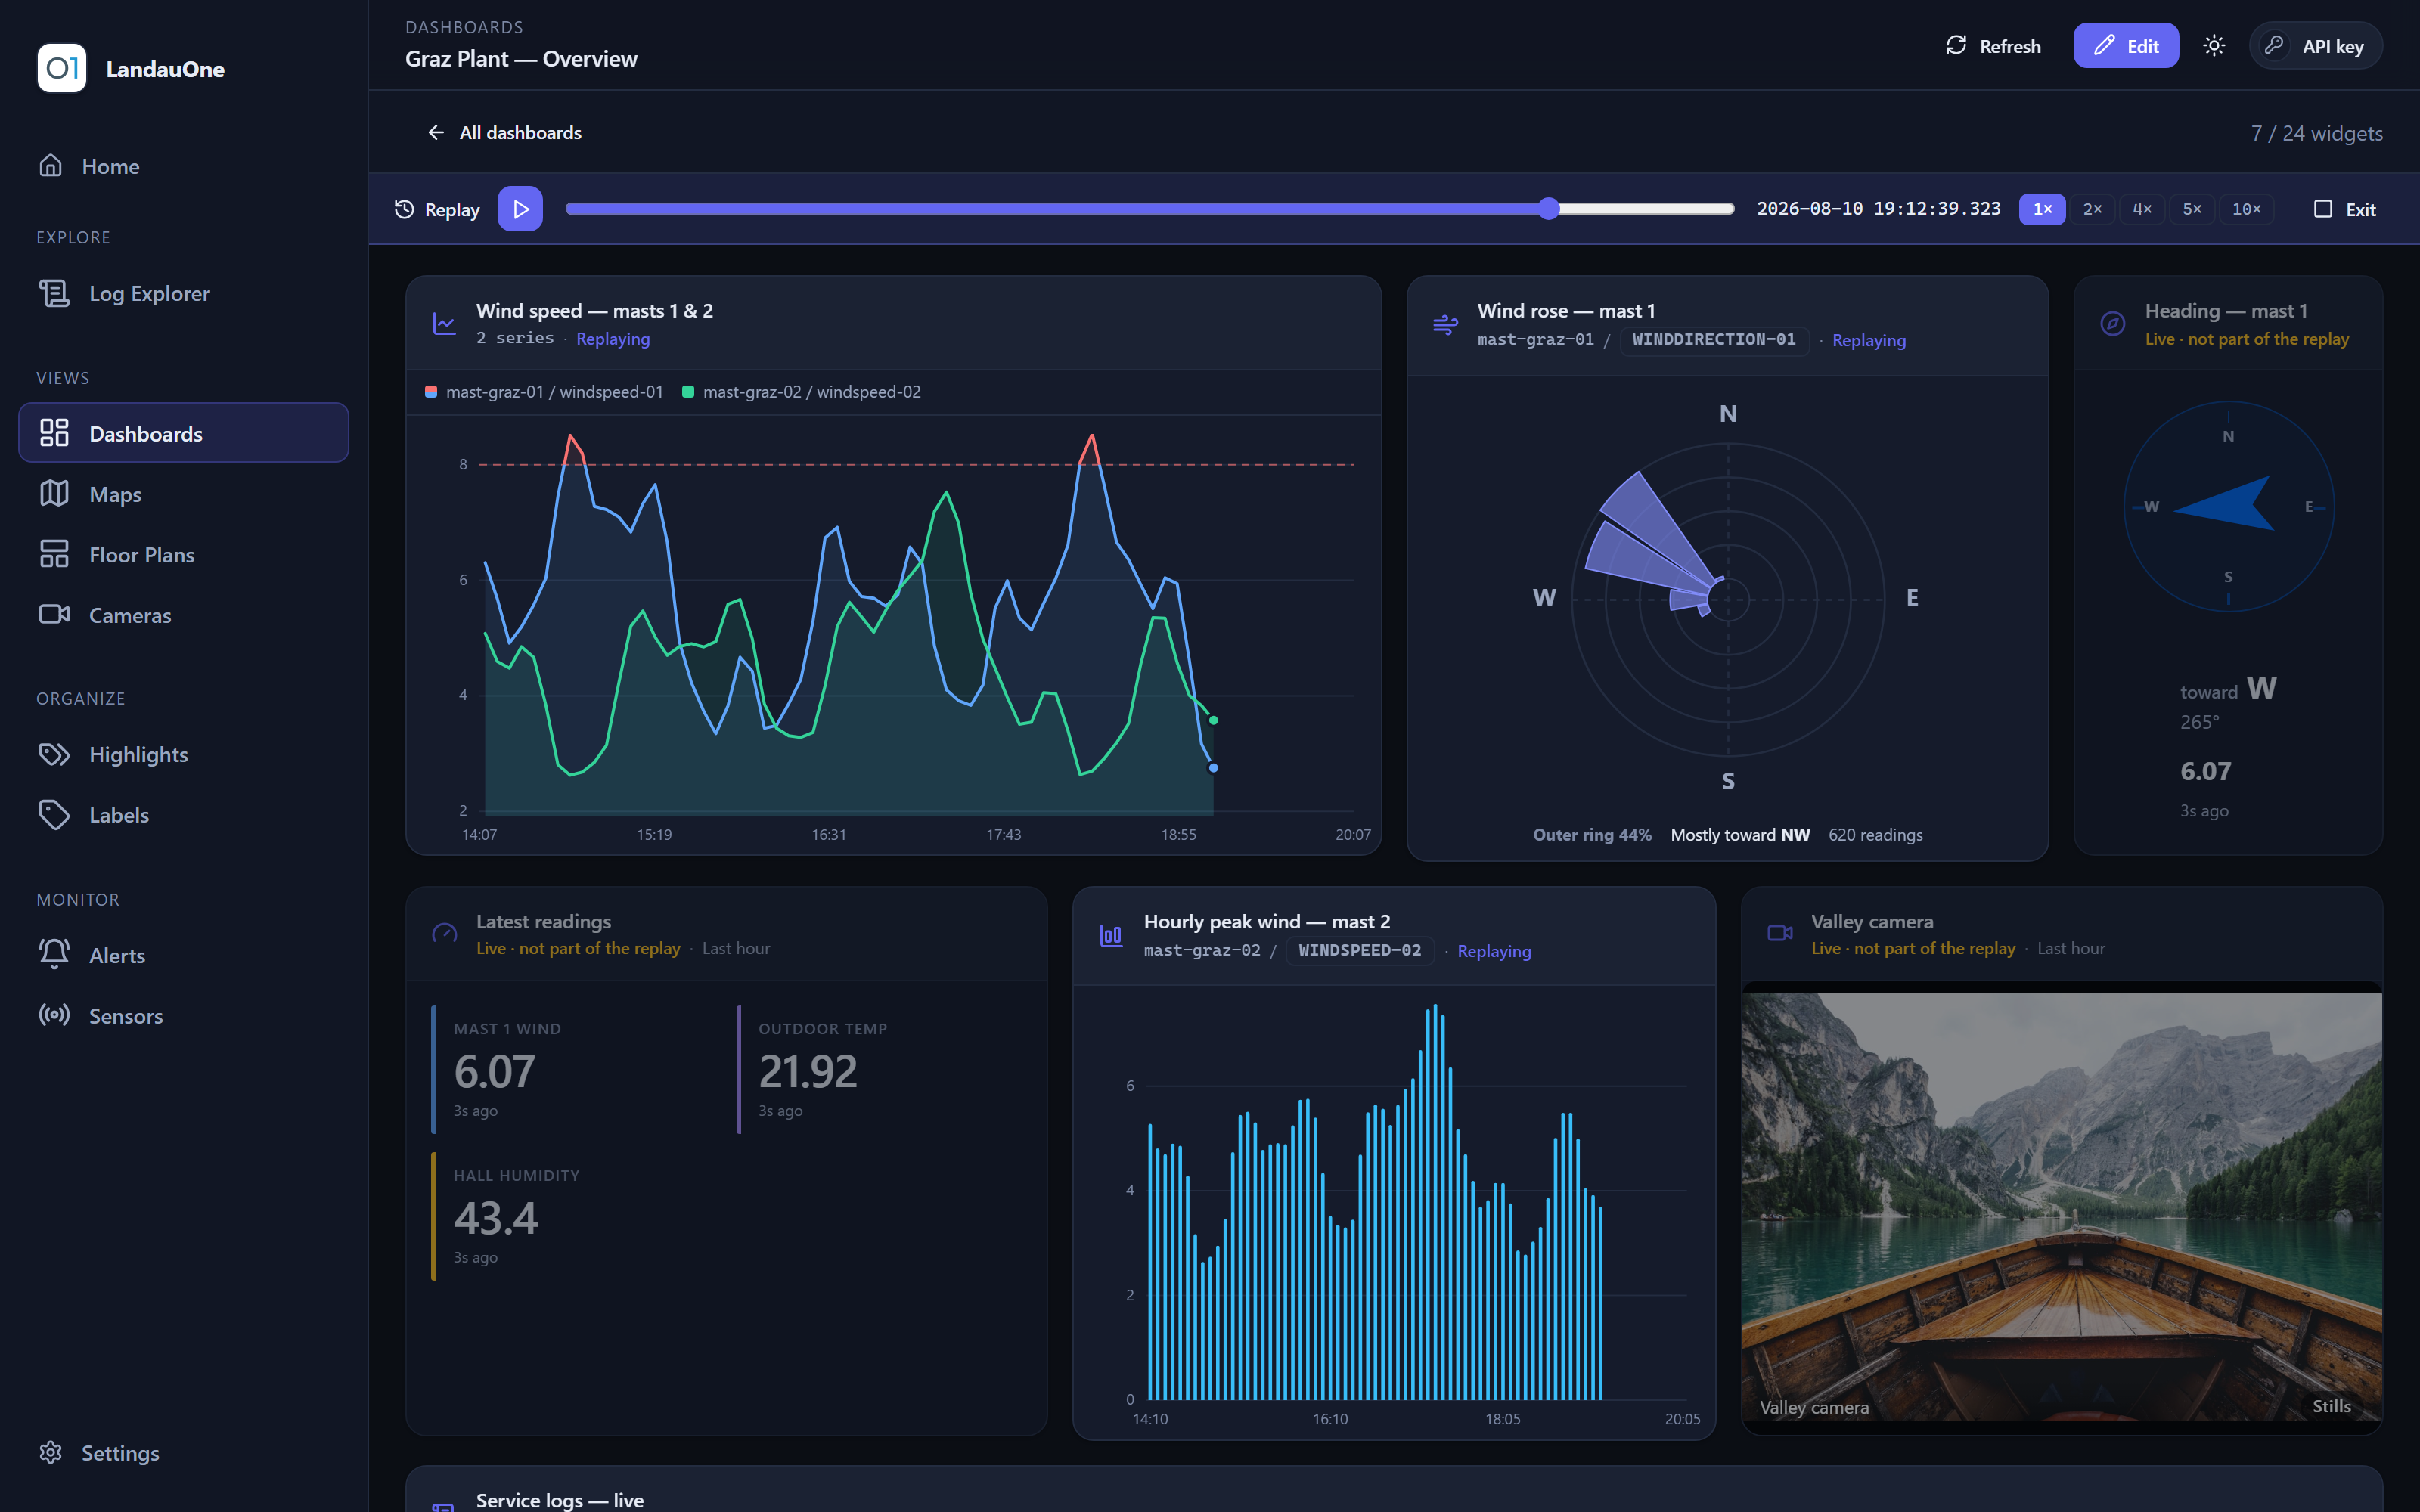
Readings, bearings, positions, live cameras and logs sit side by side and replay
together. The question every incident review turns on — what else was true at
that moment? — is answered with a click, not with exports stitched together
in a spreadsheet.
Numbers you can defend
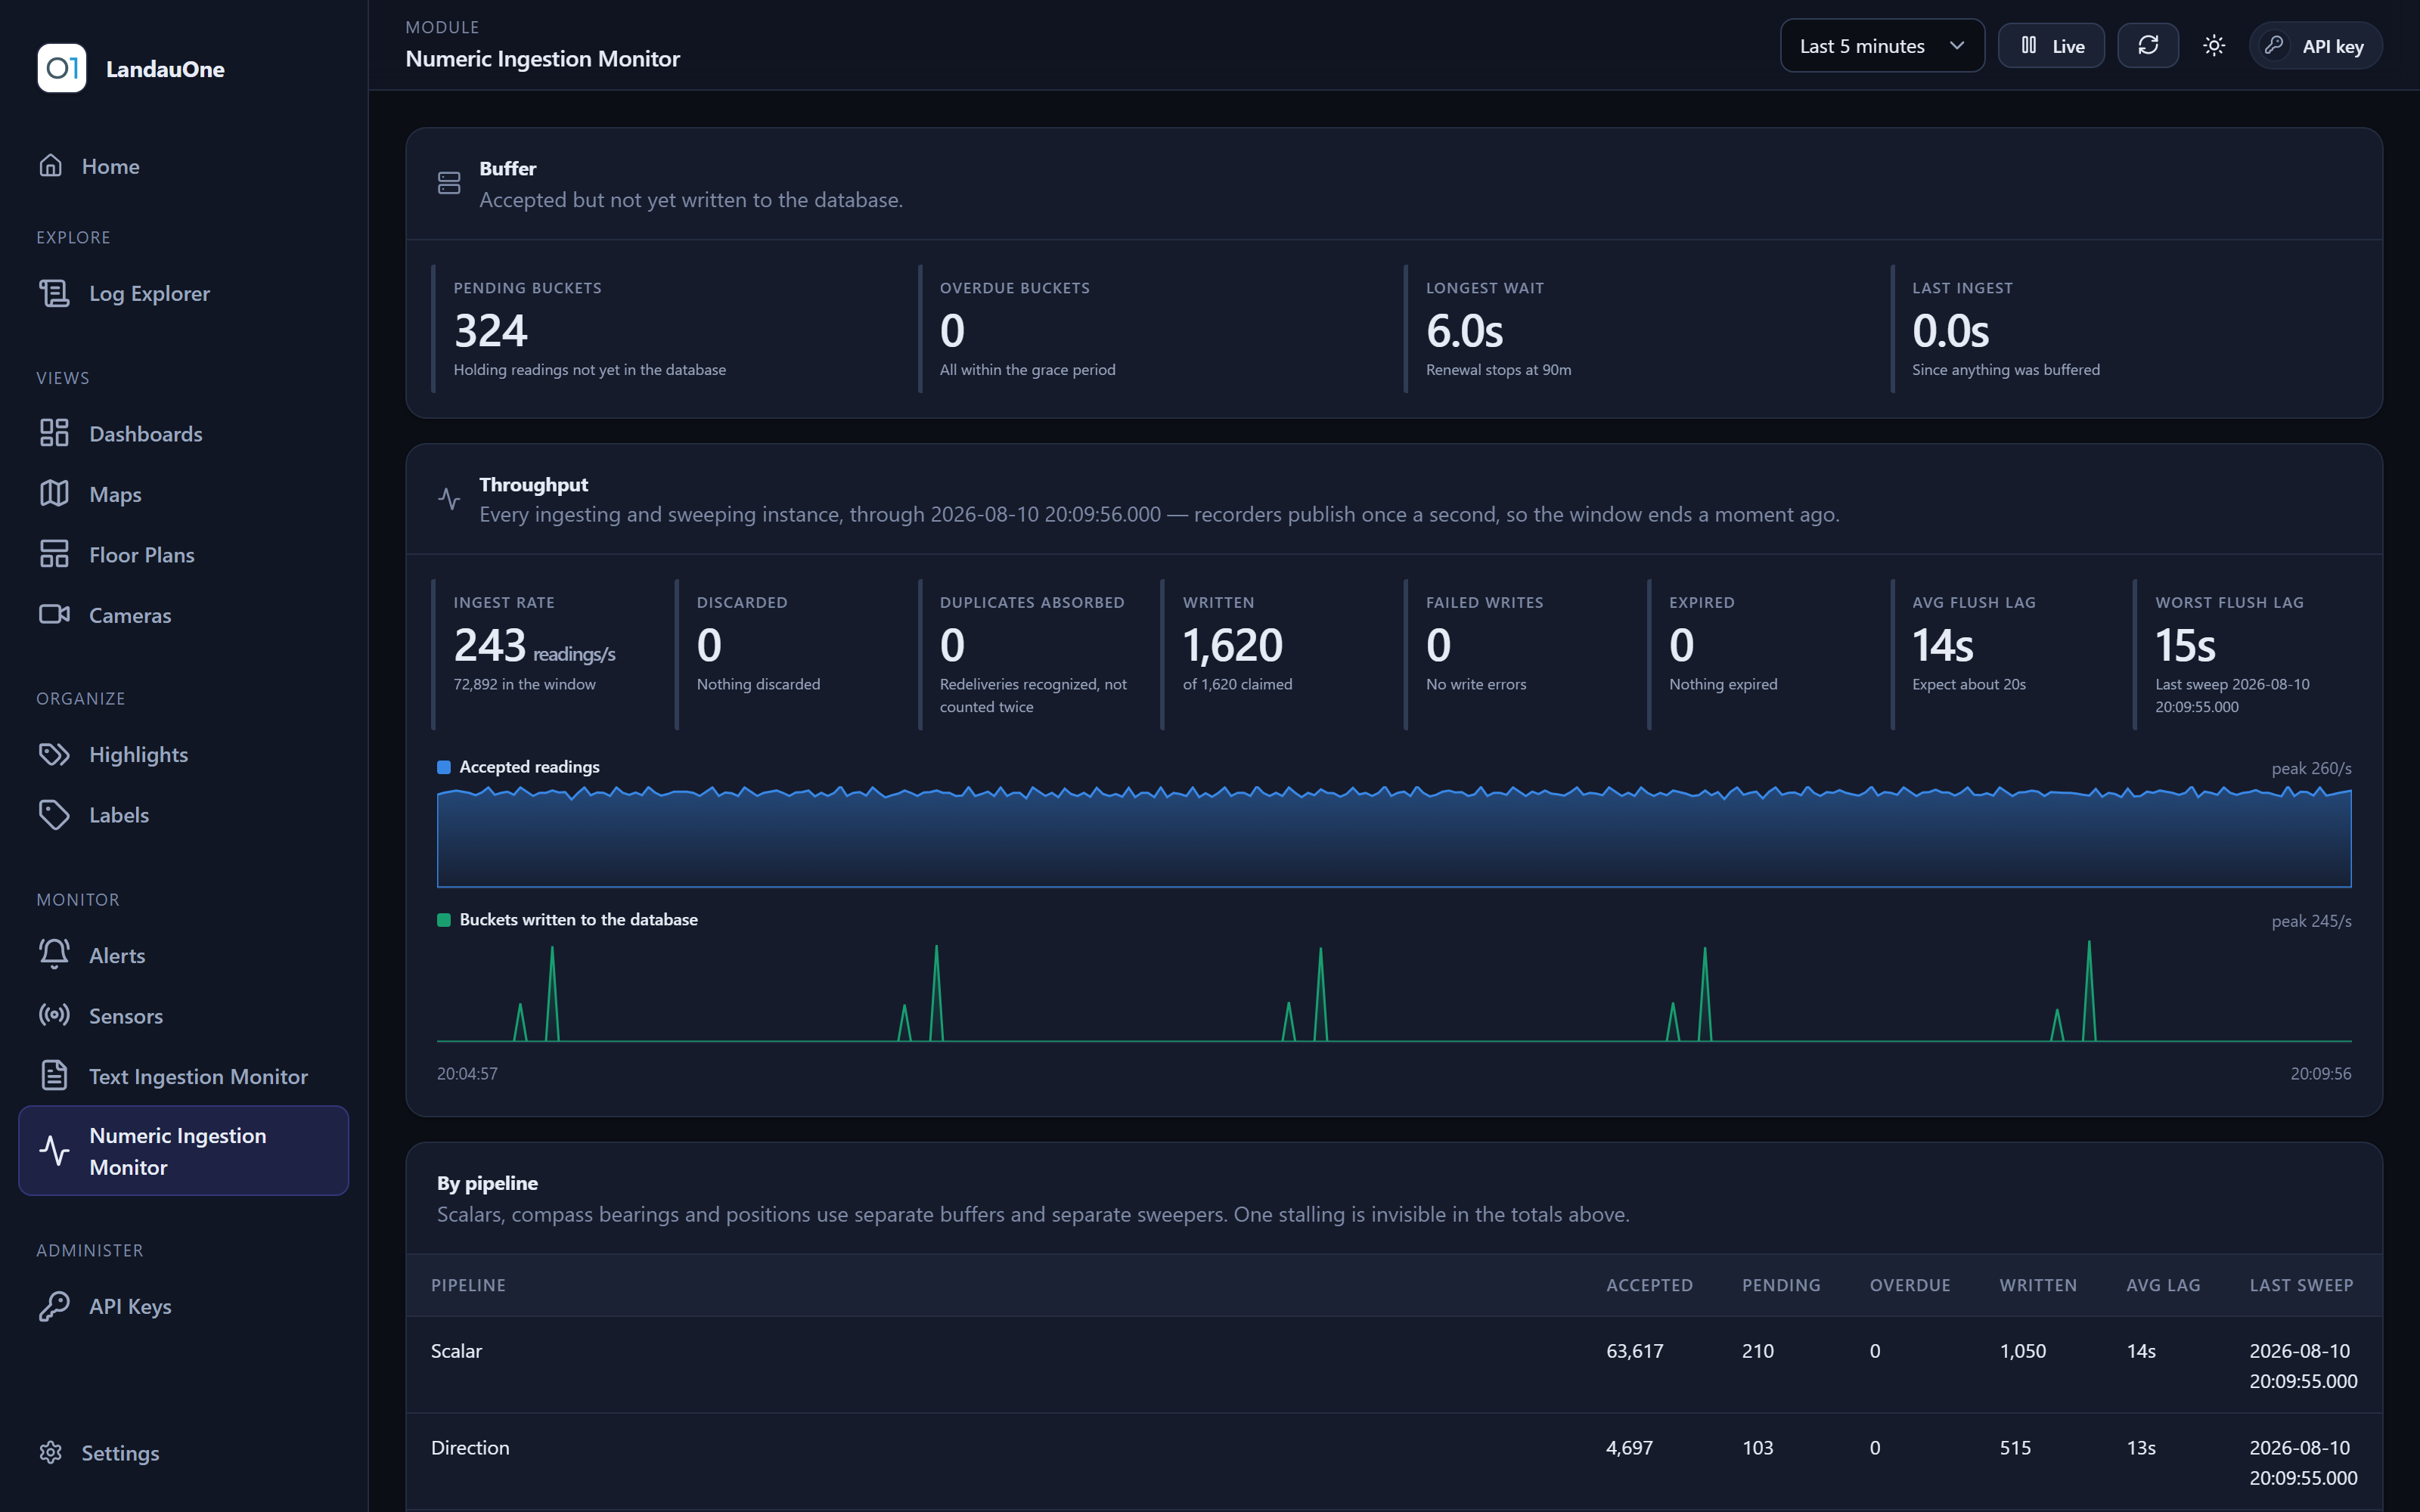
Nothing is thrown away quietly: every discarded reading is counted with a reason
and the point it was discarded at, a reading delivered twice is counted once, and
the monitors show what arrived and what is still waiting. When a chart becomes the
basis of a decision, that honesty is the feature.
Yours to run, nothing metered
Your servers or your cluster, air-gapped if the site demands it, with no per-seat,
per-sensor or per-camera meters running. Your history rests in a standard
open-source database you can query, back up and take with you — growth costs you
hardware, never a renegotiation. Licensed per deployment — one flat licence for a site or a cluster, whatever it carries; pricing on request.
Live in an afternoon
It speaks what your fleet already speaks — MQTT, Kafka, Azure Service Bus, Event
Hubs, plain HTTP, and the standard telemetry protocol for logs. Mapping a
producer's field names is configuration, not a firmware rollout, so the first
chart can appear the day the broker is pointed at it.
Capacity measured, not promised
The benchmarks ship with the product: hundreds of millions of readings a month on
a single server, verified reading-by-reading down to the last digit — and
reproducible on your own hardware before you commit a fleet to it. Ask another
vendor for the harness behind their brochure number.
Built around the person looking
You arrange the dashboards, maps and floor plans; the console remembers exactly
how you left them — viewport included — in your language and theme, on any
machine. What you build is shareable read-only: a colleague gets your view, never
a pen into your work. And video is treated as sensitive — behind sign-in, live
only, never recorded.
At a glance
And this is the whole console — sixteen modules, five intents
Everything below is described in detail further down the page; this is the map of it.
Click any module to jump straight to it.
Explore
- Log Explorersearch stored logs and open any entry in full
- Reportsa month per sensor, printed, exported or mailed on a schedule
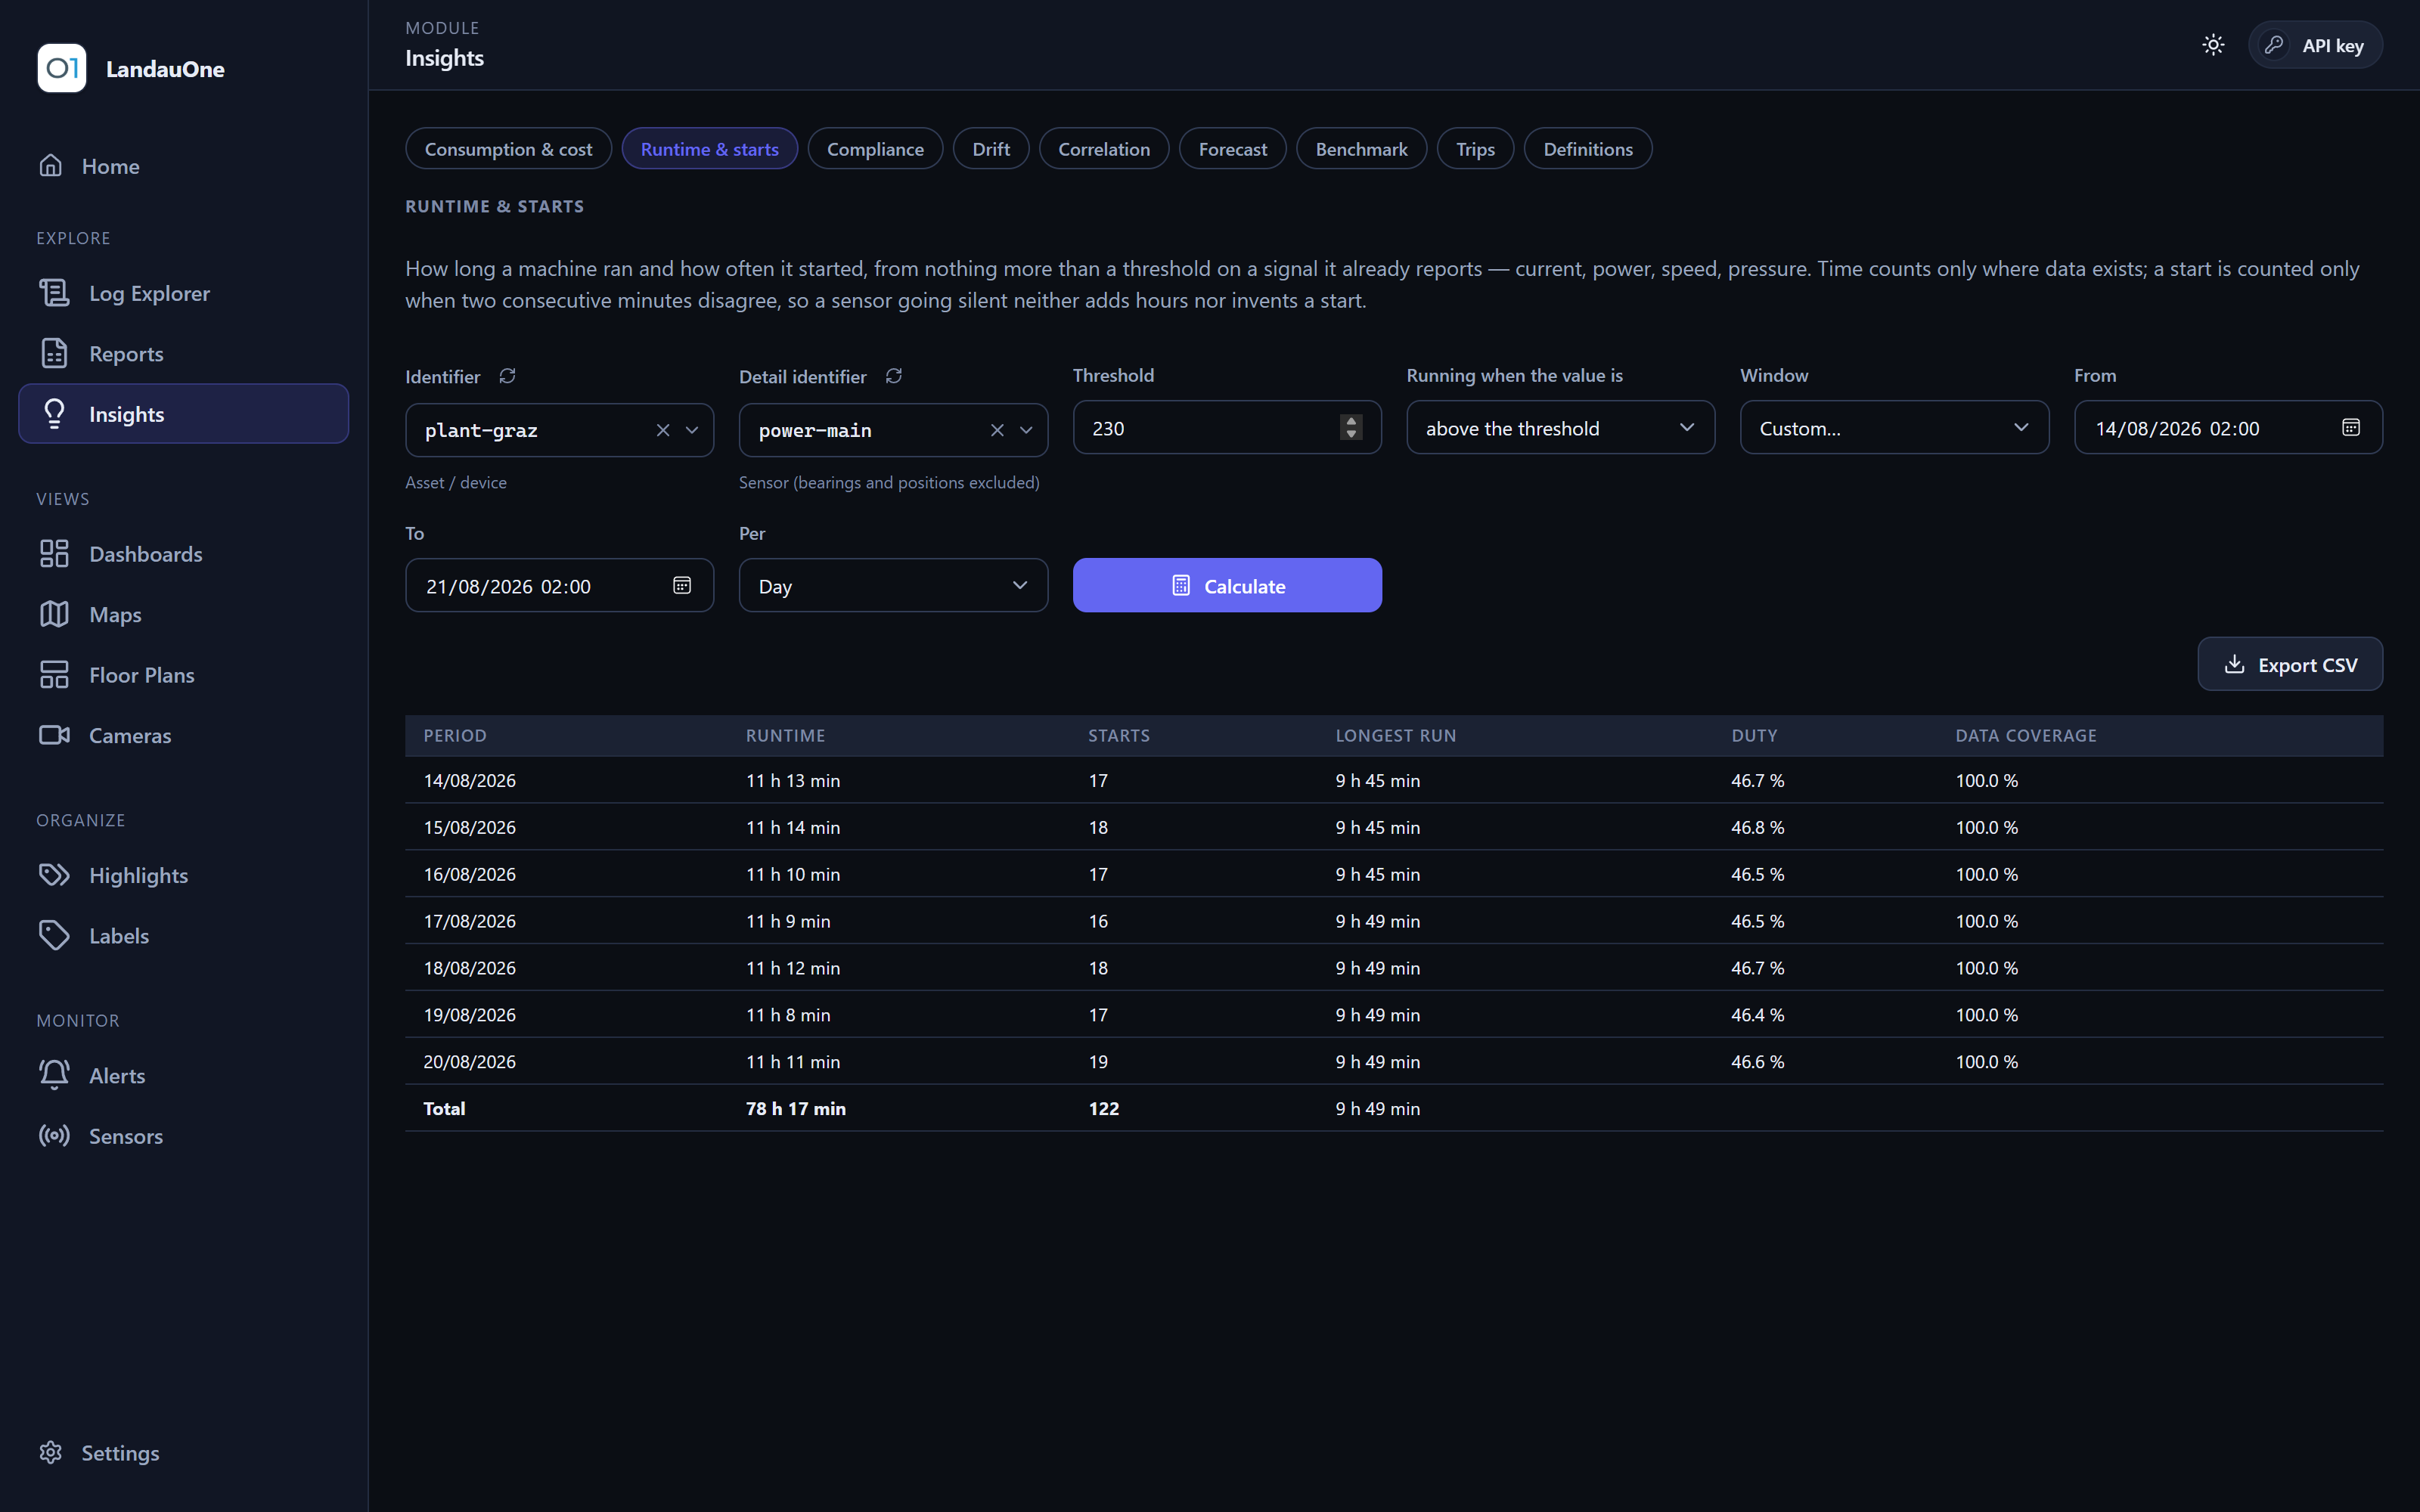
- Insightsthe business questions behind the numbers
Views
- Dashboardsseven widgets on a canvas you arrange
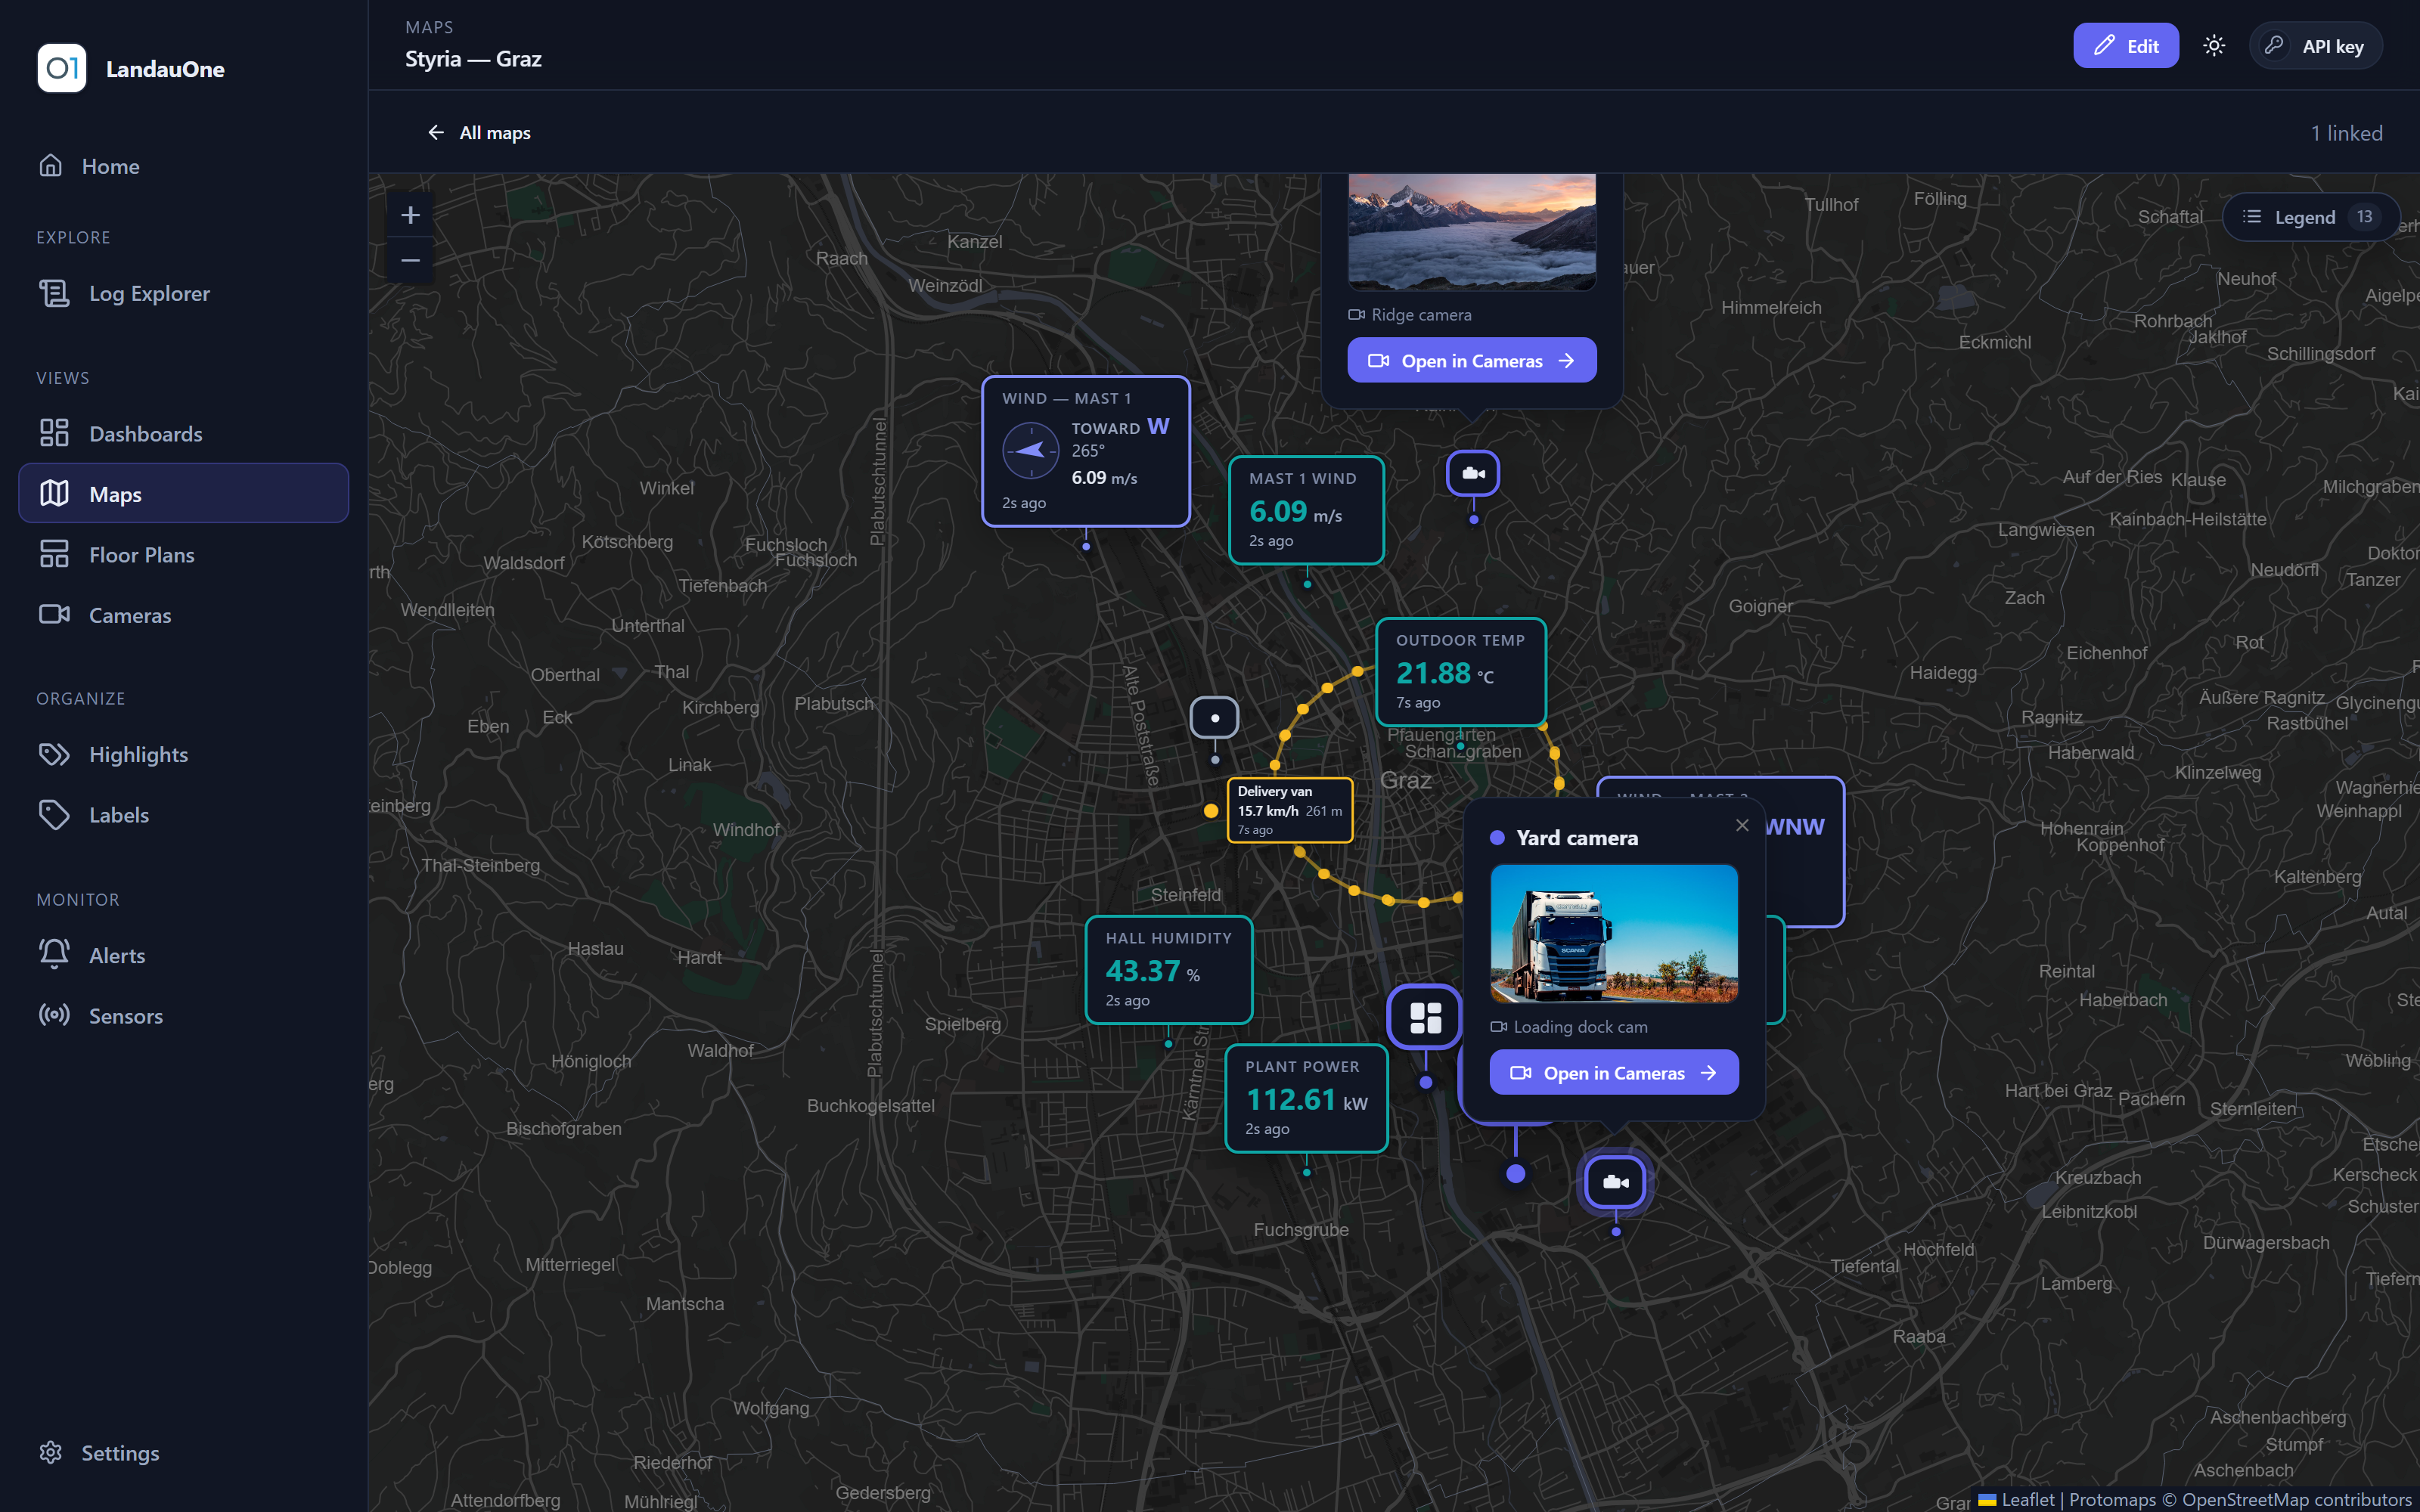
- Mapslive markers where the sensors are
- Floor Plansyour own drawings, marker by marker
- Cameraslive video, nothing recorded
Organize
- Highlightscolour the words you scan logs for
- Labelsfile and filter everything you own
Administer
- API Keysissue, scope, rotate and revoke credentials
- Auditwho changed what, estate-wide
- Storagedisk by tier, growth measured, retention in force
Every one of them speaks your language, renders in light or dark, files under your
labels, and can be shared read-only with a colleague.