LandauOne

The console

Monitor

Check that data is still arriving — alerts, the sensor registry, and the two ingestion monitors.

Alerts

Standing questions asked on a schedule, whether or not anybody is looking: tell me when this reading crosses a line I set — or when this sensor stops reporting altogether.

  • Two kinds of rule: a threshold a reading must not cross, and a silence — a series that should never go quiet longer than you allow.
  • A rule can be required to hold for a while before it fires, so a single spike does not page anyone at night.
  • Notifies by email and posts to a webhook the moment it happens — into whatever your team already watches.
  • Every firing and every recovery is recorded; events stay until somebody marks them as looked at, so nothing clears itself unseen.
  • A quiet period after each firing keeps a flapping value from becoming a flood of mail.
Sensors

A registry of what should be reporting: give each series a name, a site and a reporting interval — and the console notices the moment one goes quiet.

  • The interval is the point: until a sensor declares how often it reports, one that stops is indistinguishable from one that never existed.
  • Health at a glance — reporting, quiet and for how long — filterable by site, status and name.
  • Two failures no silence check can see: degraded (alive right now, but much of the last day never landed — each sensor shows its coverage %) and flatlined (reporting on time while the value never moves, the way a stuck transducer fails).
  • Series that have sent data but were never declared appear as discovered candidates, ready to declare one by one or import in bulk.
  • Declaring is administrative; looking is not — everyone sees the same registry, only holders of an admin grant can change it.

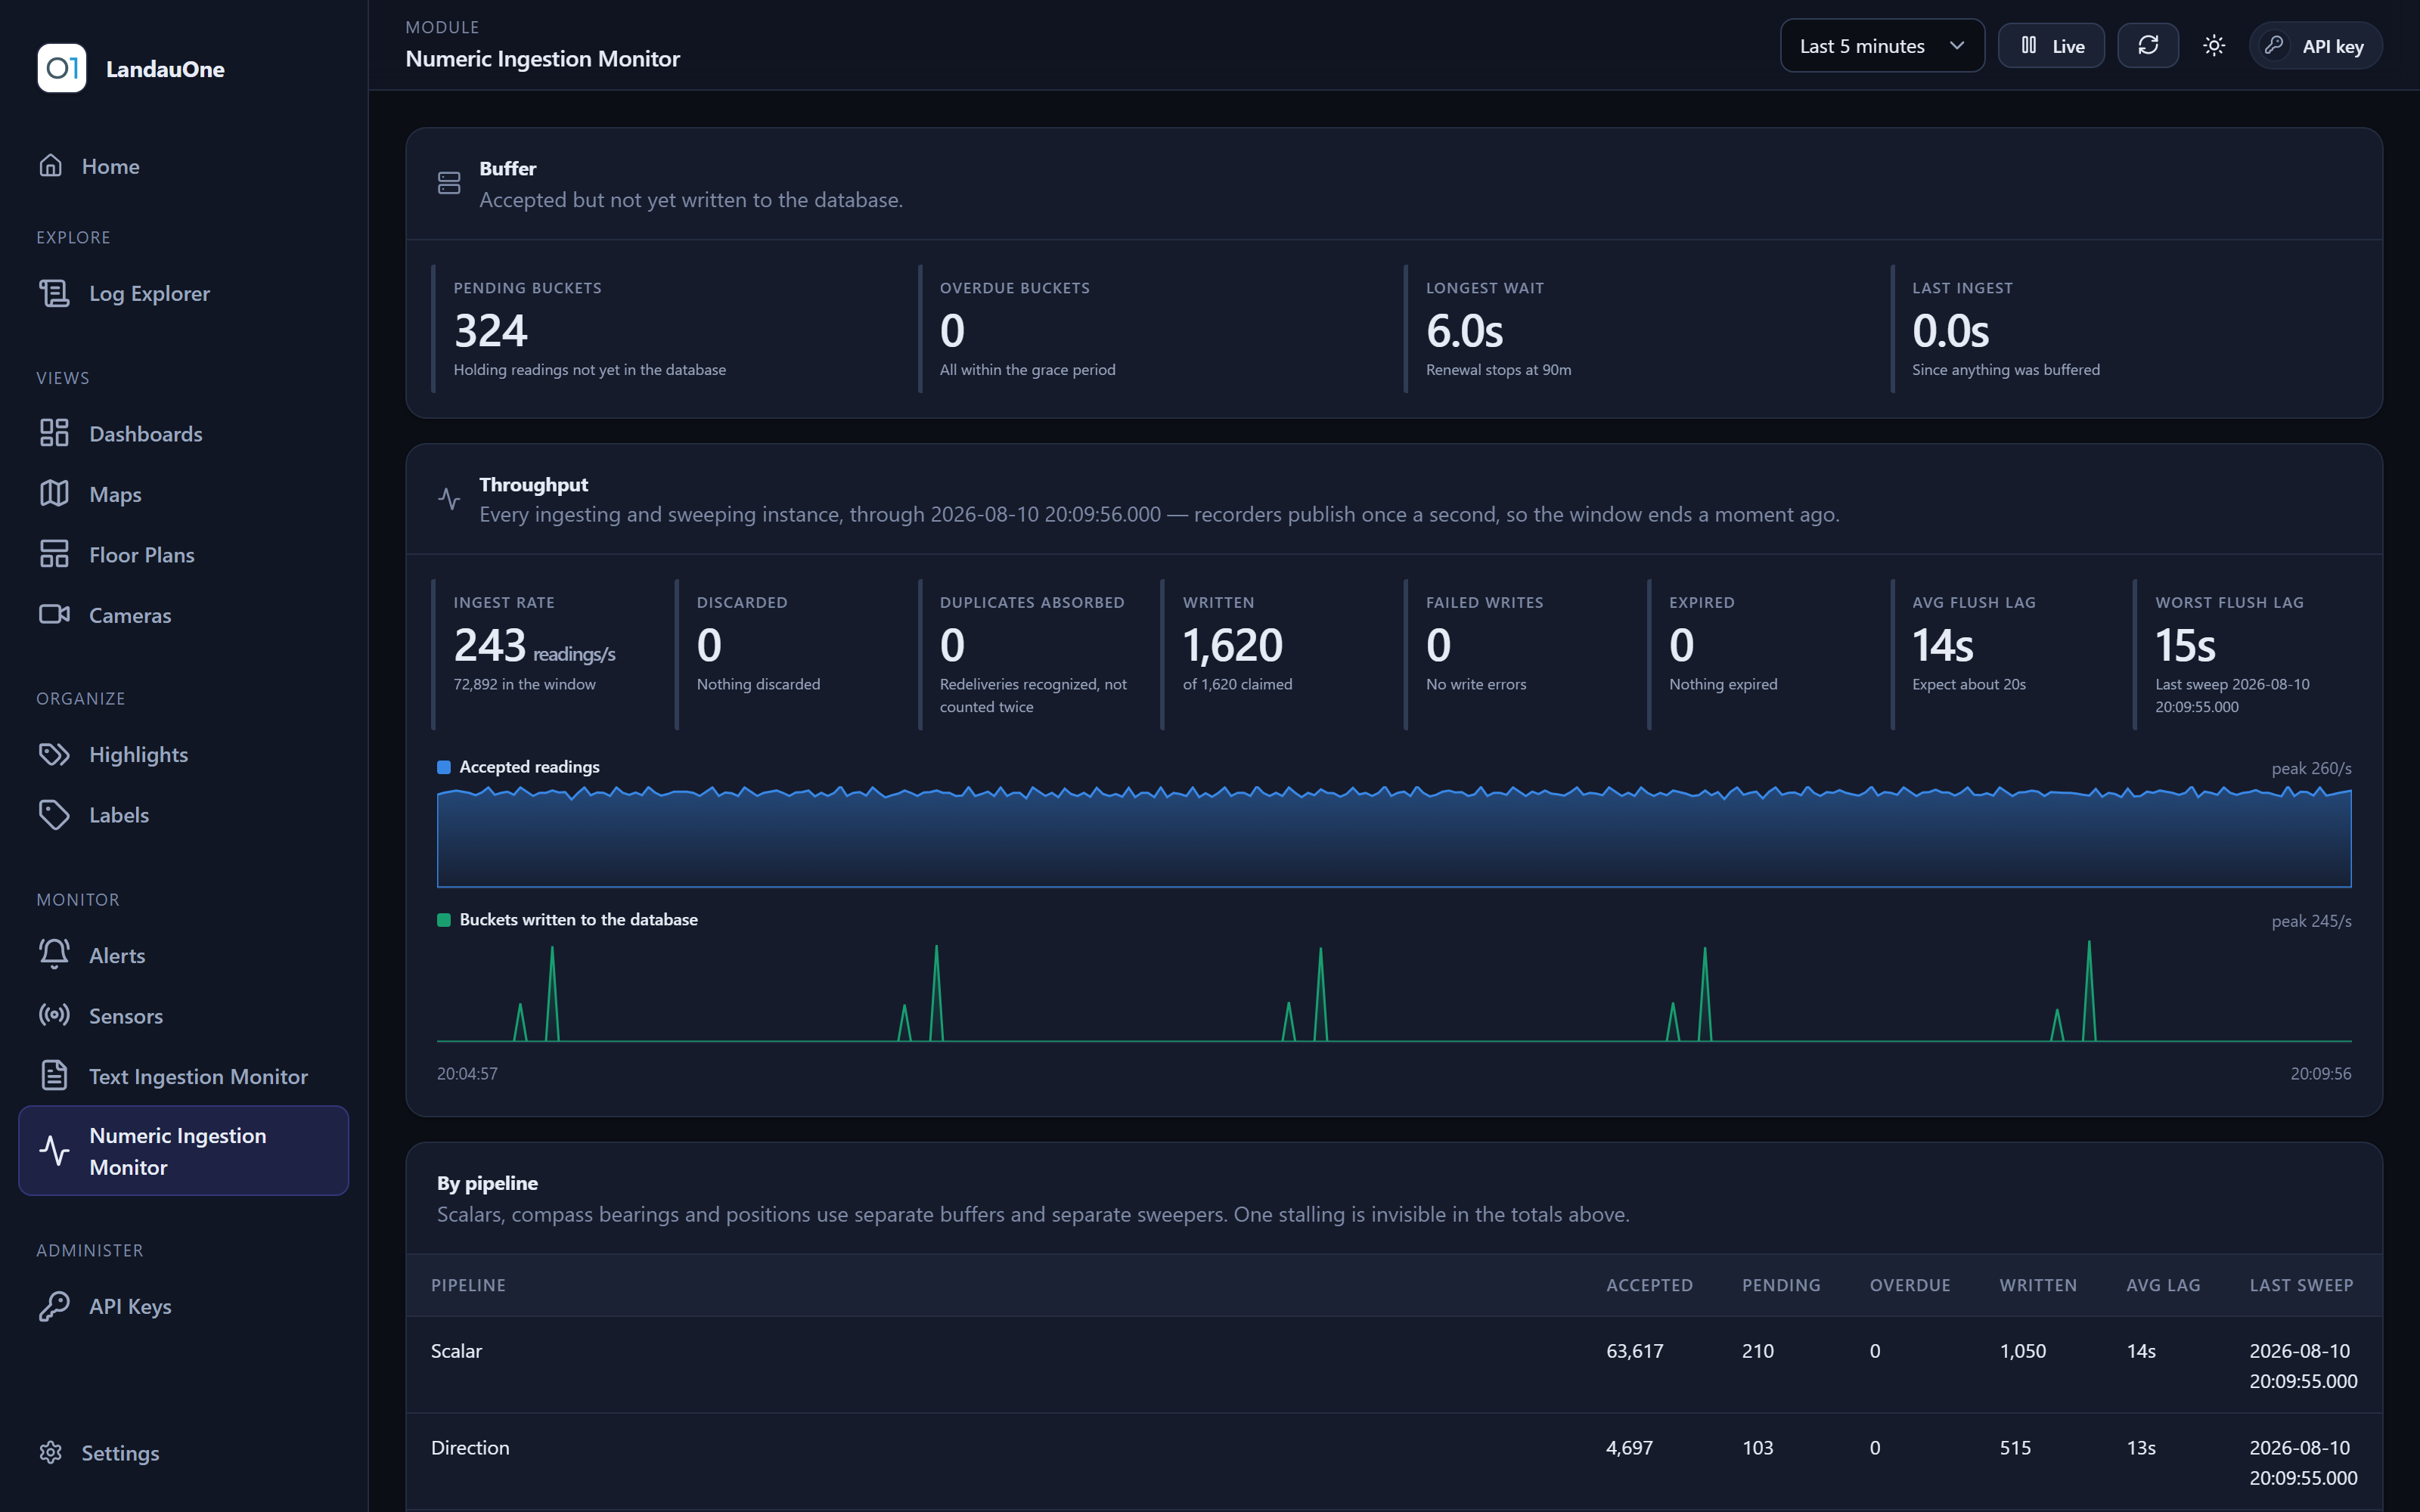
Numeric Ingestion Monitor

Watch the numbers arriving: readings accepted, readings thrown away and why, and how far behind storage the measurements, directions and positions are.

  • Accepted throughput over time, as a chart rather than a number that just moved.
  • Discards broken out by reason and by the point they were discarded at — the difference between a sender's bad data and a limit of your own.
  • How much is still waiting to be stored, and how far behind it is.
  • Every figure covers everything, not the one machine that answered.

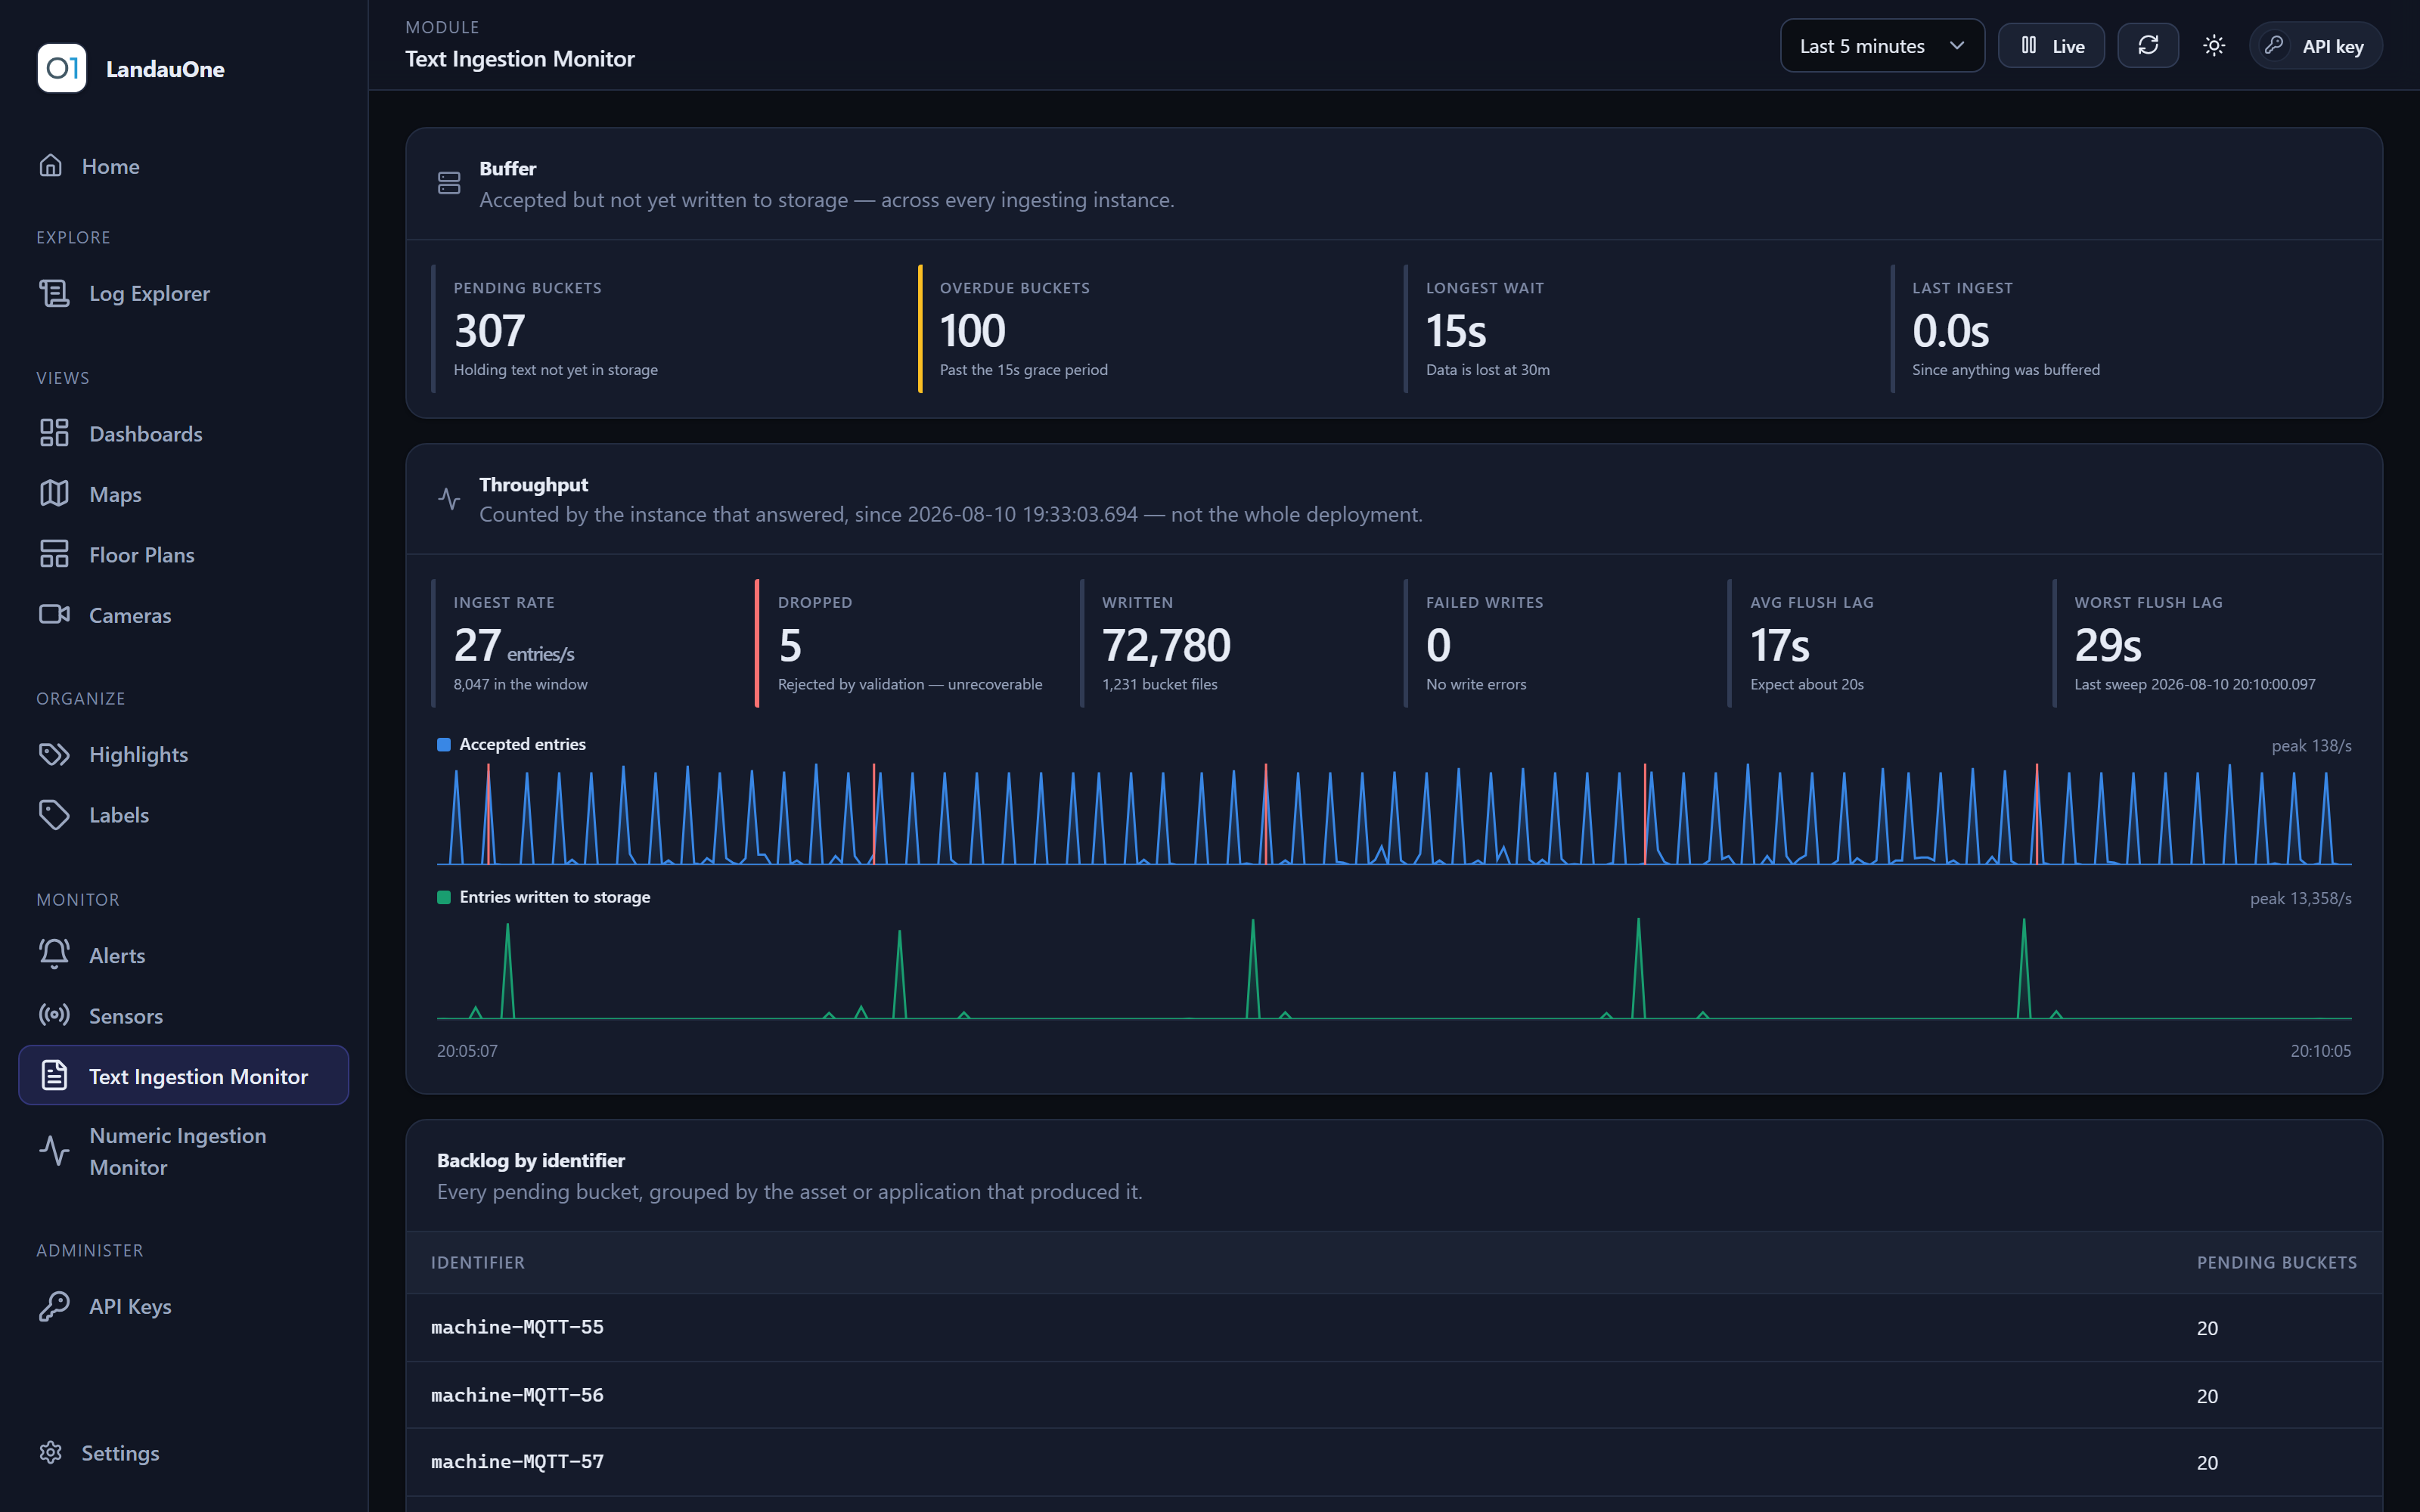
Text Ingestion Monitor

Watch the text and logs arriving: how much is being accepted, how much is still waiting, and how far behind storage is.

  • Throughput and backlog side by side, so a growing queue is visible before it becomes a gap in the data.
  • Says plainly when storage is the thing that is behind, rather than the arrival of the data.
  • Kept a separate page from its numeric twin on purpose — “is the other one healthy?” is exactly what you came to find out.
The numeric ingestion monitor with throughput chart and drop reasons.
The numeric ingestion monitor — rate, discards by reason, and how far behind storage is.
The text ingestion monitor showing throughput and buffered backlog.
The text ingestion monitor — throughput and backlog, side by side.