LandauOne

The console

Explore

Look something up — logs, a month of an asset, and the business questions behind the numbers.

Log Explorer

Search stored application logs by identifier, source and time range. Browse them in a paginated table and open any entry in full.

  • Filter by identifier, detail identifier, an absolute or relative time range, and free text the line must contain.
  • Open any row into a drawer that renders the payload as TEXT, JSON, XML or CSV — and offers a format for download only when the payload can genuinely be rendered as it.
  • Copy or download each rendering as a real file: .txt, .json, .xml, .csv.
  • Rows carrying one of your Highlights words are marked in that group's colour as they arrive.
  • Asking for one minute is as quick as asking for one minute out of a week — the range you choose does not decide how long you wait.
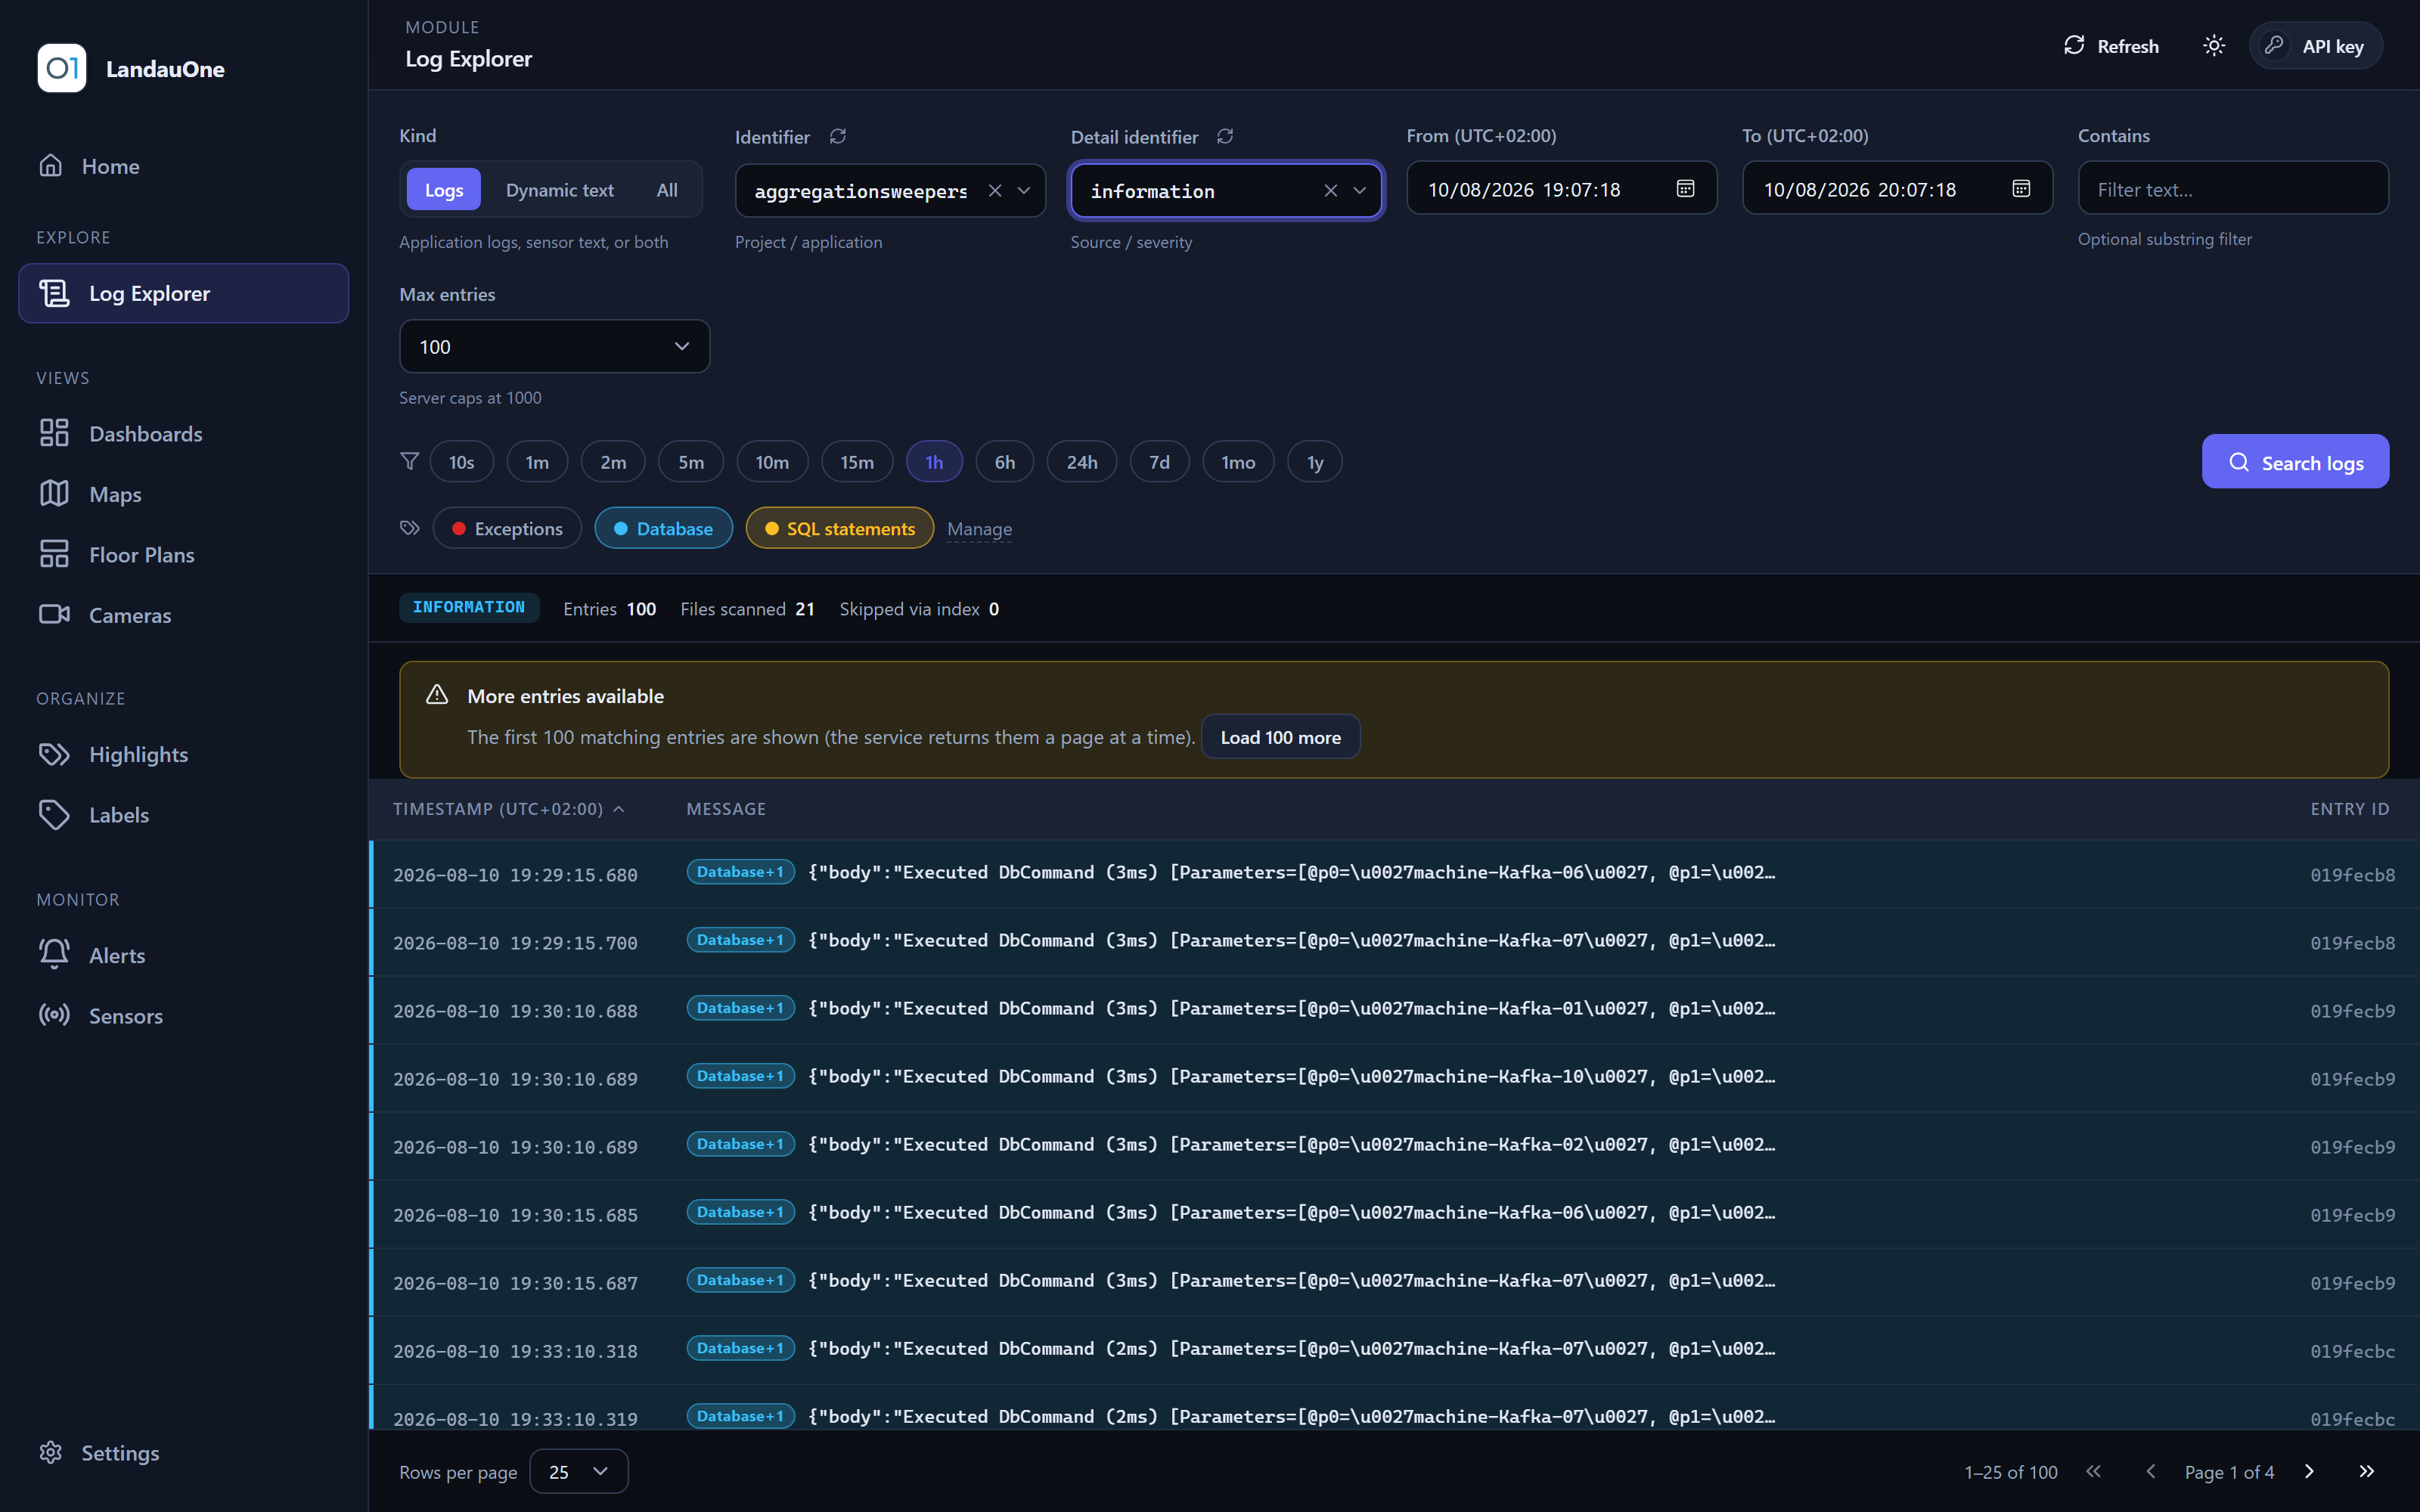
Log Explorer: a filter bar above a paginated table of log rows, with matches highlighted.
Log Explorer, with a highlight group marking every line that mentions a failure.

Reports

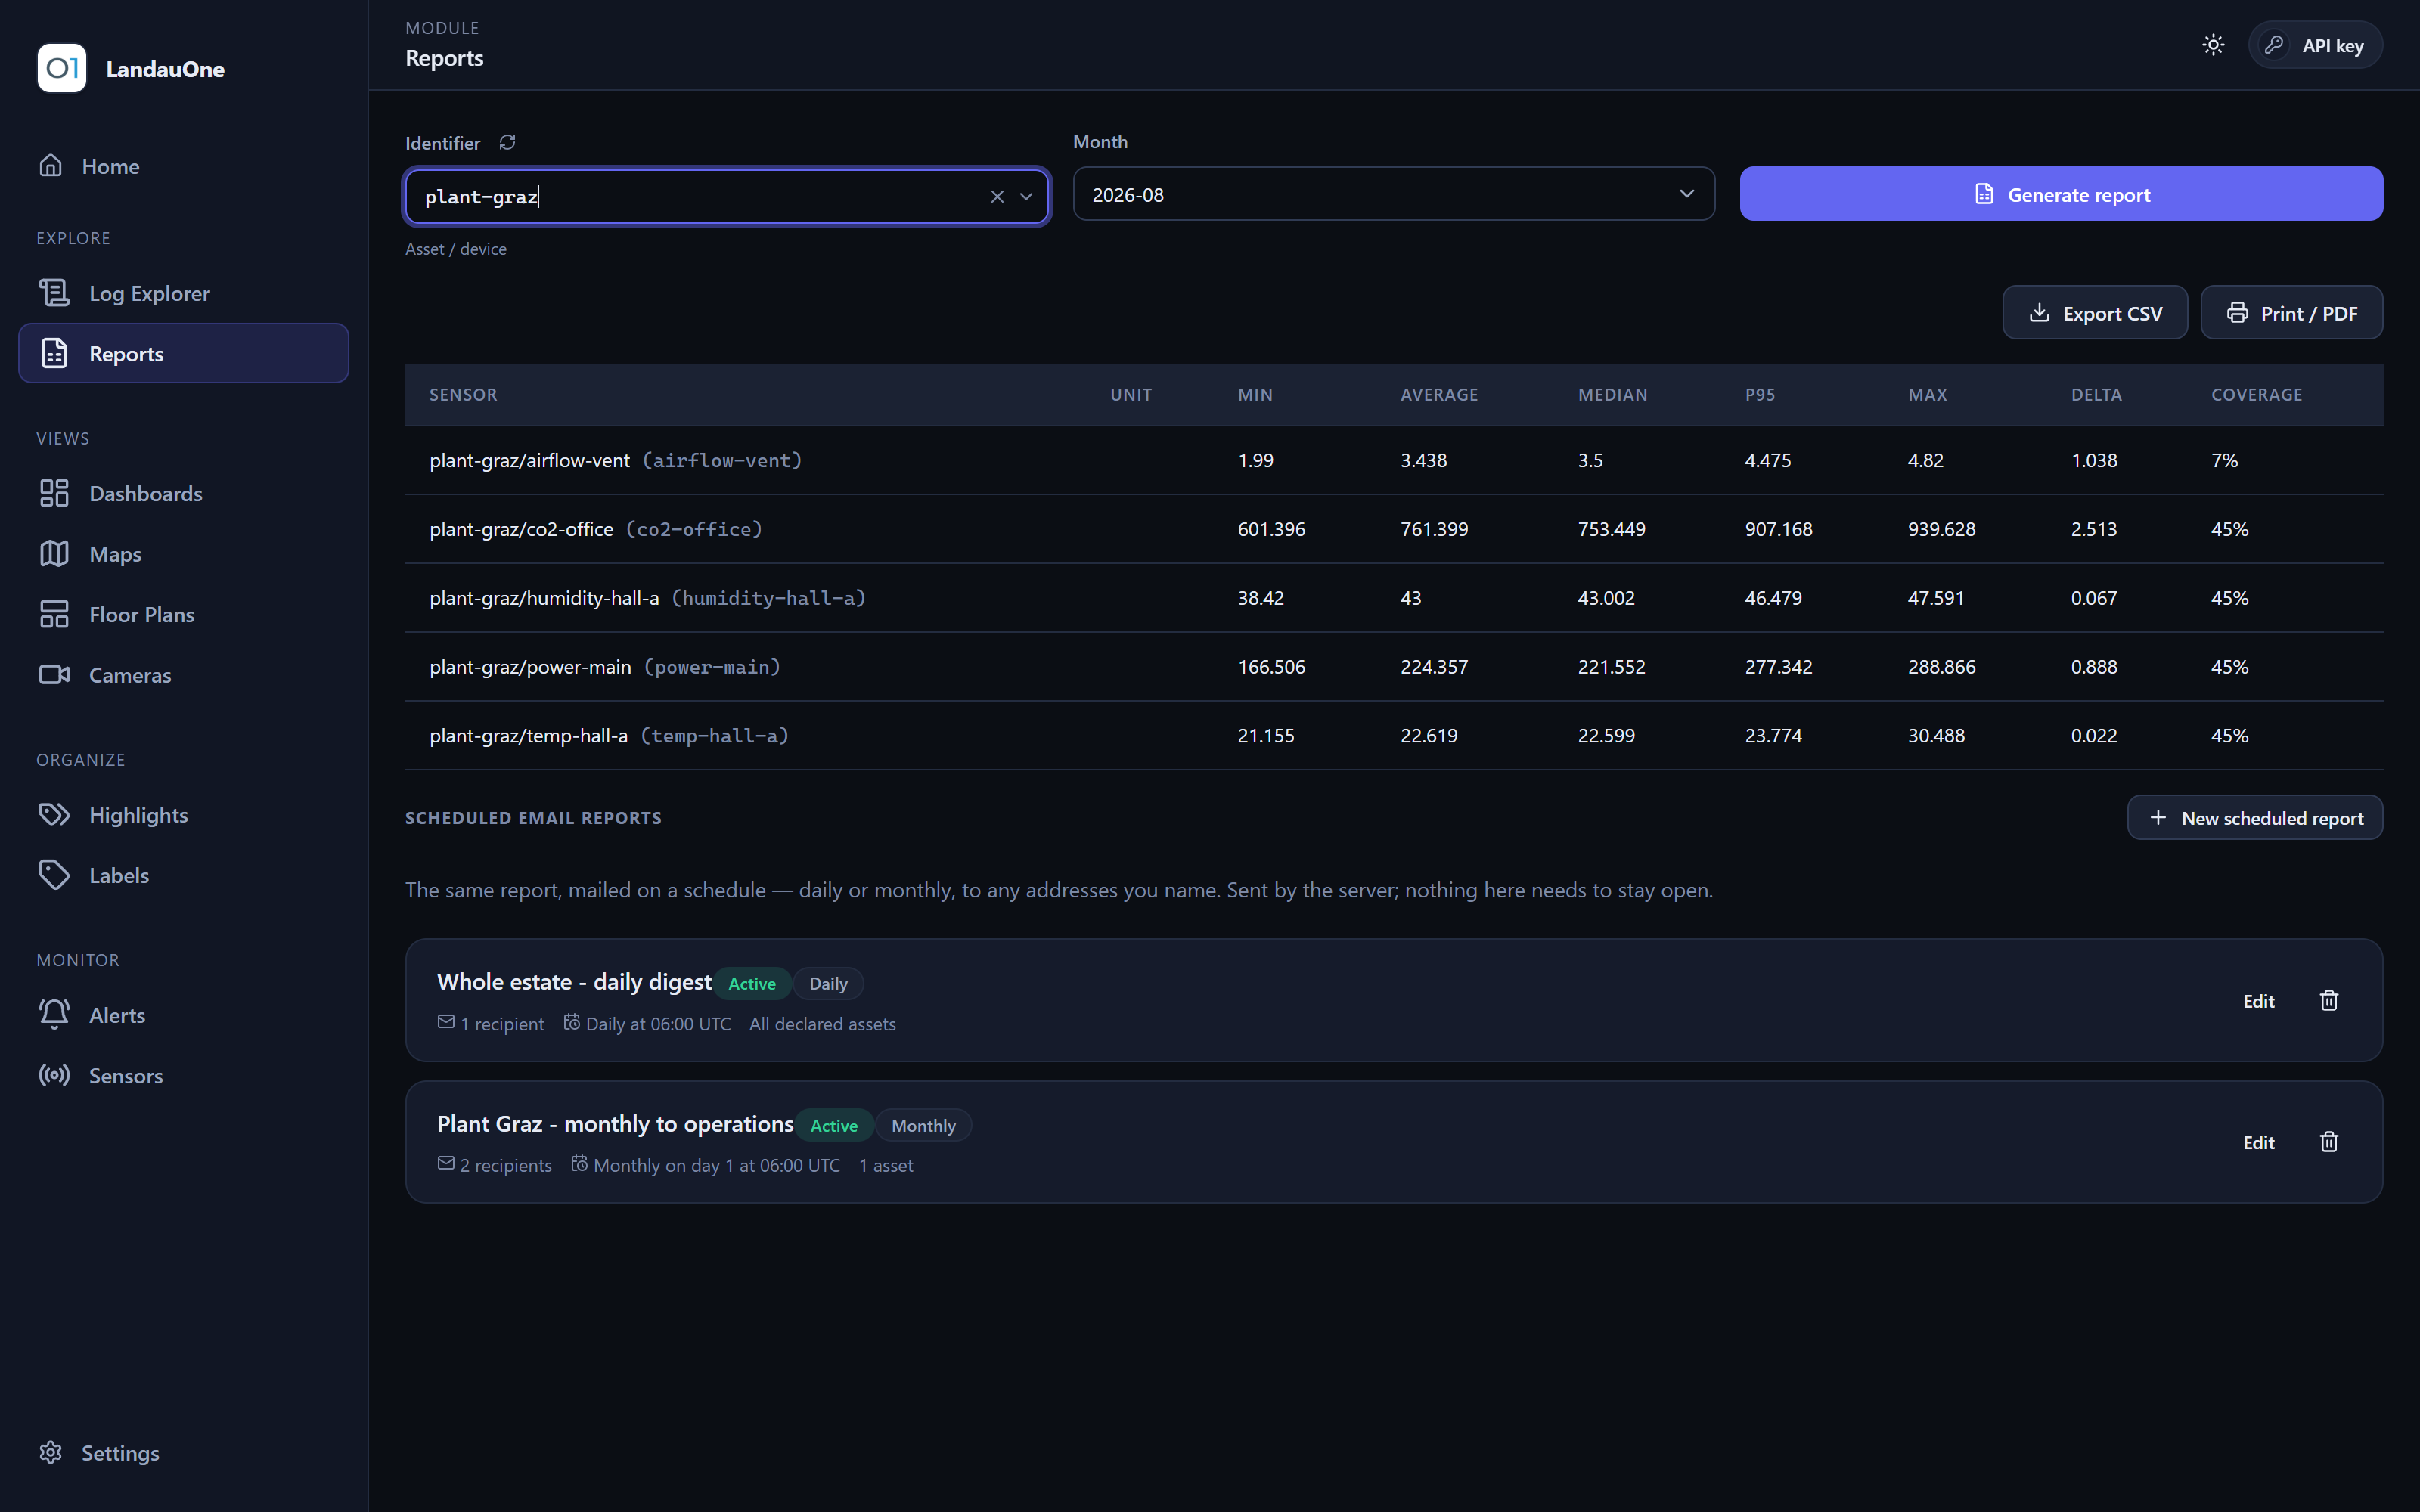
A month of any asset, one row per sensor: minimum, average, median, P95, maximum, consumption and data coverage — the numbers a facility manager forwards.

  • Pick an asset and a month; past months answer from precomputed summaries, so even a large site costs a handful of reads.
  • Print it — the browser's own dialog turns it into a PDF — or export it as CSV.
  • Scheduled email reports: the same report, mailed daily or monthly to any addresses you name, with the CSV attached. Managed like alert rules — saved once, sent by the server while nobody is logged in.
The Reports module: a monthly per-sensor table with minimum, average, median, P95, maximum, consumption and coverage, above two scheduled email reports.
A month of one asset, one row per sensor — and beneath it, the schedules that mail the same report daily or monthly.

Insights

The business questions behind the stored numbers, answered from what is already there — no export, no spreadsheet, no second system.

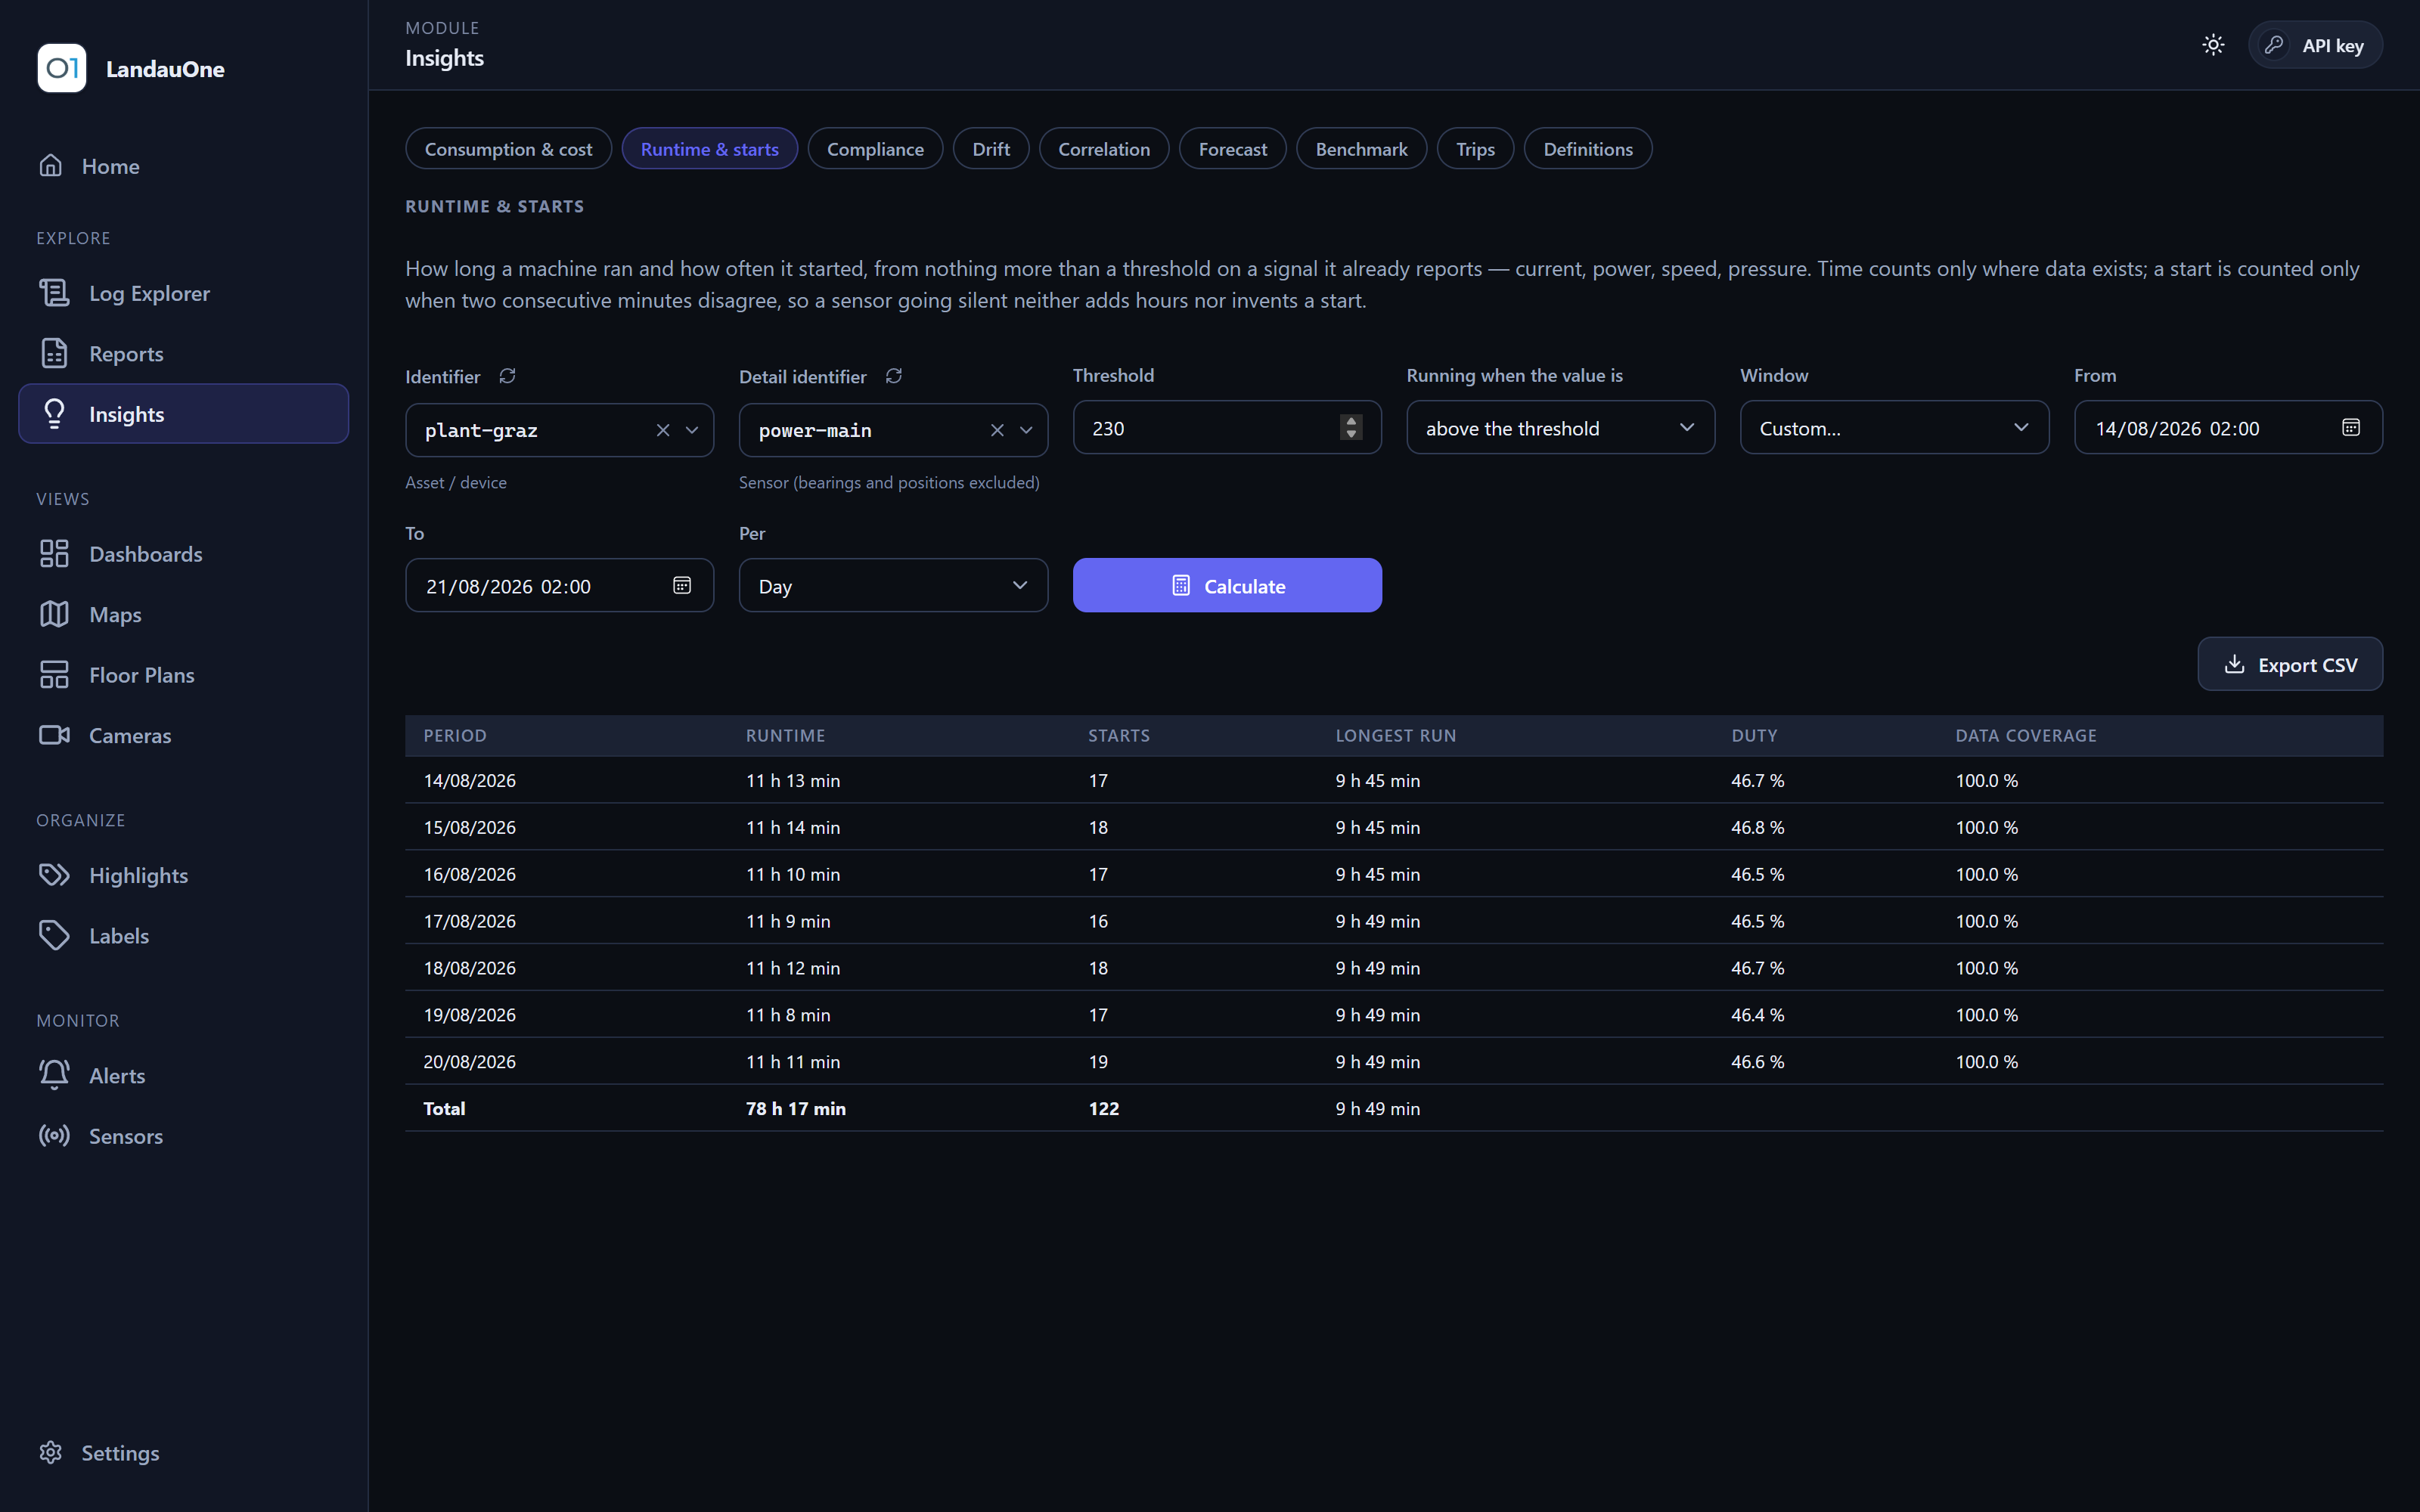
Consumption & cost Runtime & starts Compliance Drift Correlation Forecast Benchmark Trips Definitions
  • Consumption & cost — a meter priced hour by hour under your own tariff windows, in the tariff's time zone.
  • Runtime & starts, compliance evidence, drift from normal, lagged correlation, forecasts, sites compared and trips — one panel each, every result exportable as CSV.
  • Definitions — tariffs, sites and per-asset normalisers, saved once and reused by every question that needs them.

Every question, explained

The Insights module: the Runtime & starts panel for a plant's main power feed, one row per day with runtime, starts, longest run, duty and data coverage.
Insights — a week of a plant's main feed as runtime, starts and duty per day, from nothing more than a threshold on the power it already reports.